Validating the qPCR
1. Validation and optimization of qPCR
Aim of this step: Find the best qPCR reaction conditions for your samples with specific PCR-mix.
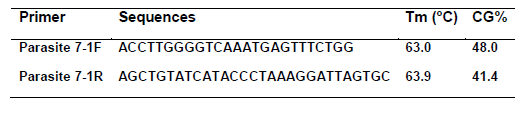
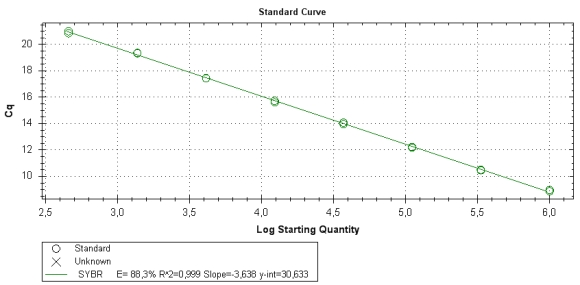
As for any qPCR assay, measuring the PCR efficiency is a crucial part of testing and suitable efficiency value is proof of successful validation. For this assay test the qPCR efficiency of parasite 7-1 primers (see table below) with your samples.
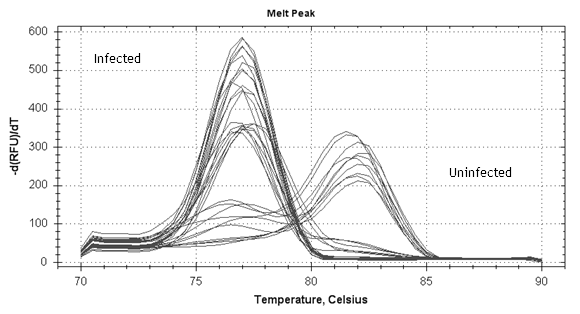
The melting curve is an efficient way to analyze PCR-products after qPCR. In this assay it is used to seperate unspecific product from specific. The melting peak should be sharp and smooth (see picture below). Melting peak should also have a consistent melting temperature; any deviations can be caused by unspecific product. We also recommend analysing the PCR product in an agarose gel to verify the correct (~250 bp) fragment length. Once efficiency, melting peaks and fragment size are within satisfactory limits your can continue to identify the parasites.